
Categories
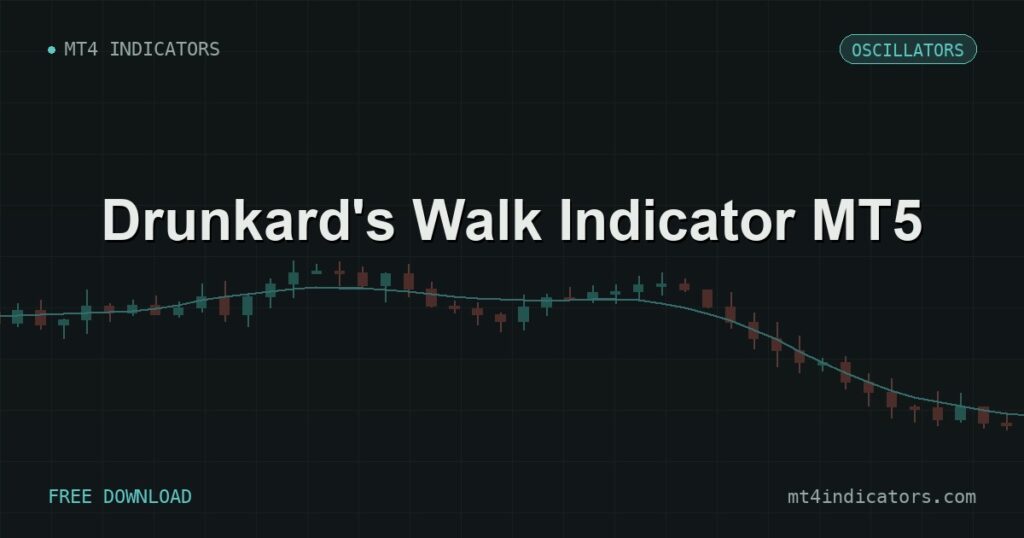
Drunkard’s Walk is a free MT5 sub-window indicator by mladen (2018) that adapts the classic Random Walk Index concept, measuring whether price’s recent high and low are moving further than a pure random walk would predict, and plotting whichever direction is currently dominant as a shaded band and a solid trend line. It’s an instant download for traders who want a statistical gut-check on whether a move looks like a genuine trend or just noise.
The Adaptive Random-Walk Formula Behind the Lines
For each bar, the indicator finds the highest high and lowest low over a backward-looking window sized by the inpPeriod input (default 40), then measures how many bars back those extremes sit. It also builds a true-range-style value for every bar (the high/low range expanded to include the previous close), and instead of always averaging that true range over a fixed 40 bars, it maintains an adaptive count that resets and re-anchors — using an EMA-style smoothing constant (2/(1+inpPeriod)) — every time the dominant direction flips from the prior two bars. In practice, this means the averaging window shortens right after a reversal and gradually lengthens back out again while a trend persists, rather than using one fixed lookback throughout.
Using that adaptive true-range average and count, the indicator computes two Random Walk values: valu (how far the current high sits above the recent low, scaled by the average range and the square root of the count) and vald (how far the recent high sits above the current low, scaled the same way). Whichever of the two is larger becomes the plotted “Trend line” value for that bar — green when valu wins (the upward random-walk reading is stronger), red when vald wins (the downward reading is stronger). Both valu and vald are also plotted individually as dotted “Line up”/”Line down” series and shaded as a filled band between them, so you can see both readings and which one is currently dominant, not just the winner.
How to Read It
- Trend line color — green means the upward Random Walk reading currently exceeds the downward one; red means the reverse. A color flip marks a shift in which direction looks statistically stronger.
- Shaded band width — a wide gap between the up and down dotted lines shows one direction clearly dominating; a narrow, overlapping band shows the two readings are close, which is a weaker, more indecisive signal.
- Adaptive lookback behavior — because the averaging window shortens right after a flip, the indicator can react a bit faster to a fresh reversal than a fixed-period Random Walk Index would, then gradually smooths back out as the new trend matures.
Input Parameters (Actual Defaults From the Code)
- inpPeriod = 40 — the base lookback window for the highest-high/lowest-low search and the starting point for the adaptive true-range averaging count; it also sets the EMA-style smoothing constant used when the count re-anchors after a reversal.
Where This Fits in a Trading Plan
Because a Random-Walk-Index-style reading is fundamentally a statistical filter rather than an entry trigger, Drunkard’s Walk works best paired with a separate execution method: use the color of the Trend line and the width of the shaded band as a background confirmation that a directional move is statistically meaningful before acting on signals from another tool, rather than treating a color flip alone as a buy or sell instruction. Its single-input simplicity also makes it easy to run on multiple symbols at once without a lot of per-instrument tuning, which suits traders scanning several charts for the clearest, most one-sided reading rather than fine-tuning one pair in isolation.
Honest Limitations
Drunkard’s Walk has exactly one user-facing input, which makes it simple to apply but leaves little room to tune sensitivity beyond changing that single period. The adaptive re-anchoring logic depends on internal state carried bar-to-bar in a work array, so on the very first bars after loading, the readings are still stabilizing and shouldn’t be read with full confidence until the count has built back up to something close to the full period. And like any Random-Walk-Index-style tool, a “trend line wins” signal here is a statistical comparison of two ranges, not a directional price target or entry trigger on its own — it’s best used as a filter alongside a separate entry method rather than traded on its color flips in isolation.
- inpPeriod (default 40) — Base lookback for the highest-high/lowest-low search and the starting point for the adaptive true-range averaging count; also sets the EMA-style smoothing constant used when the count re-anchors after a reversal.
FAQs About the MT4 Drunkard's Walk Indicator MT5
Does the Drunkard's Walk indicator repaint?
No. The loop only recomputes the current forming bar and any new bars, and every value (valu, vald, the adaptive true-range average) is built strictly from the current bar and earlier bars, so completed bars keep their plotted values.
What does the shaded band between the dotted lines mean?
It’s the gap between valu (the upward Random Walk reading) and vald (the downward reading) for each bar — a wide band shows one direction clearly dominating, a narrow band shows the two readings are close and the signal is weaker.
What makes this an 'adaptive' Random Walk Index instead of a standard one?
A textbook Random Walk Index averages the true range over one fixed period. This version re-anchors its averaging count using an EMA-style constant every time the dominant direction flips between the last two bars, so the effective lookback shortens right after a reversal and lengthens again as the new trend persists.
What does a color flip on the Trend line mean?
It marks the bar where the larger of valu/vald switches sides — green means the upward reading currently exceeds the downward one, red means the opposite, so a flip signals a shift in which direction looks statistically stronger.
What timeframes suit this indicator?
With a 40-bar base lookback and Random-Walk-Index-style scaling, it’s built for swing-style analysis on higher timeframes (H1 and above) where a 40-bar window represents a meaningful stretch of price history rather than a few minutes of noise.
Drunkard’s Walk Indicator MT5
Drunkard's Walk is a free MT5 sub-window indicator by mladen (2018) that adapts the classic Random Walk Index concept, measuring whether price's recent high and low are moving further than a pure random walk would predict, and plotting whichever direction is currently dominant as a shaded band and a solid trend line. It's an instant…
Download the Drunkard's Walk Indicator MT5