
Categories
DT Oscillator Indicator
The DT Oscillator Indicator for MT4 combines RSI and Stochastic logic to detect overbought and oversold conditions. Download this free, reliable momentum tool for MetaTrader 4.
Download the DT Oscillator IndicatorDT Oscillator Indicator for MT4
The DT Oscillator Indicator for MT4 is a powerful momentum tool that combines the strengths of both the Relative Strength Index (RSI) and Stochastic Oscillator to help traders identify overbought and oversold market conditions. This dual-calculation approach provides a clearer picture of trend direction and potential reversals, making it a trusted indicator for technical traders across all timeframes.
Available for free download, the DT Oscillator works seamlessly on MetaTrader 4 and can also be used on MT5. It’s designed to highlight turning points in price action, filter out noise, and confirm potential trade setups with accuracy.
How the DT Oscillator Indicator Works
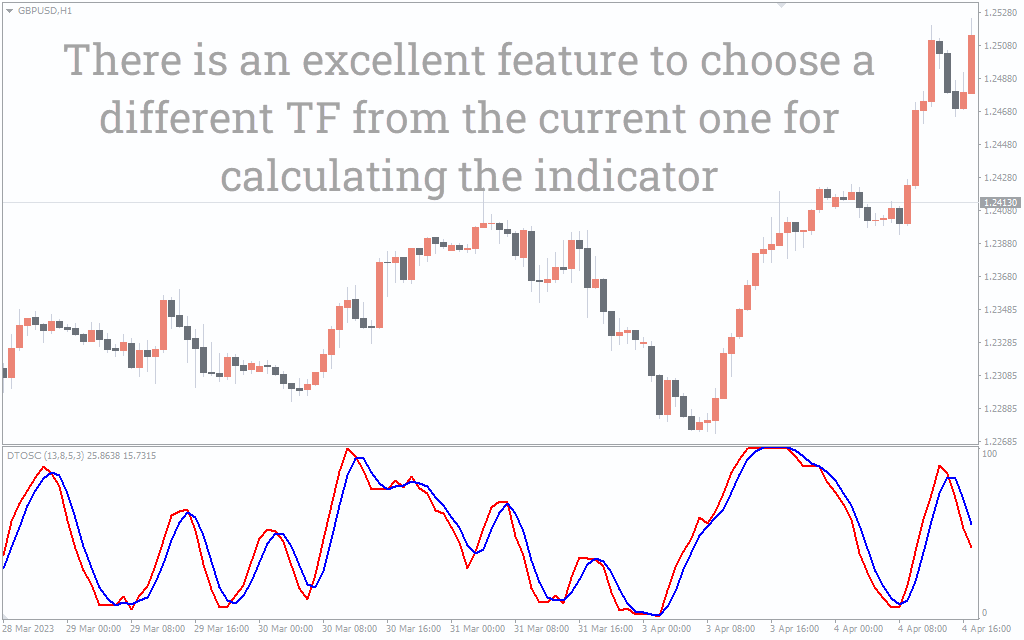
The DT Oscillator calculates RSI and Stochastic values simultaneously and plots them on a scale from 0 to 100:
-
0 to 20 represents oversold conditions, suggesting the market could be preparing for a bullish reversal.
-
80 to 100 represents overbought conditions, signaling that a bearish reversal might be approaching.
When the oscillator rises from oversold territory and crosses upward, it may confirm bullish momentum. When it turns downward from overbought territory, it may confirm bearish momentum.
Because it blends two oscillators, the DT Indicator provides smoother, more reliable signals than using RSI or Stochastics alone.
Key Features of the DT Oscillator Indicator
-
Dual-calculation system: Combines RSI and Stochastic logic for better precision.
-
Visual clarity: Easy-to-read oscillator line that helps identify potential reversals quickly.
-
Adjustable parameters: Users can customize RSI and Stochastic periods to suit different trading styles.
-
Cross-platform compatibility: Works on both MetaTrader 4 and MetaTrader 5.
-
Versatile across timeframes: Effective for scalping, intraday, swing, and long-term analysis.
How to Trade Using the DT Oscillator
The DT Oscillator can be applied in several practical trading approaches.
Overbought and Oversold Trading
-
Buy Signal: When the oscillator moves near 0 – 20 and turns upward, it suggests a possible bullish reversal.
-
Sell Signal: When the oscillator moves near 80 – 100 and starts to turn down, it indicates a possible bearish reversal.
Trend Confirmation
Use the DT Oscillator to confirm overall market direction:
-
If the oscillator consistently stays above the 50 level, the market is in an uptrend.
-
If it remains below 50, the market is likely in a downtrend.
Combining with Other Indicators
To increase reliability, traders often combine the DT Oscillator with:
-
Moving Averages for trend direction.
-
RSI or Stochastics for additional signal confirmation.
-
Support and Resistance Zones to verify high-probability reversal areas.
Example Strategy
-
Wait for the oscillator to drop near 20 or below.
-
Confirm a bullish reversal with a candle pattern or RSI divergence.
-
Place a buy order with a stop-loss below the recent swing low.
-
Take profit near the next resistance or when the oscillator reaches the 80 zone.
Conversely, for short setups, reverse the logic: sell near 80–100 when the oscillator turns down and momentum confirms.
Why Use the DT Oscillator Indicator?
-
Combines two proven tools: Merges RSI and Stochastics into one efficient indicator.
-
Reduces false signals: Smoother transitions help filter out minor price fluctuations.
-
Simple visual interpretation: Perfect for traders who prefer straightforward, color-coded oscillators.
-
Customizable: Works for any asset, including currency pairs, indices, and commodities.
Conclusion
The DT Oscillator Indicator for MT4 is an excellent tool for traders looking to identify market extremes and improve timing for entries and exits. By combining RSI and Stochastic calculations, it delivers reliable momentum readings and trend confirmation on any timeframe. Whether you are a beginner learning to recognize reversals or an experienced trader refining your strategy, this indicator can enhance your analysis and trade confidence.
Download the DT Oscillator for free and start using it to find overbought and oversold zones with precision in MetaTrader 4.
Timeframe: Mentions the current timeframe.
PeriodRSI: The default value is 13. It shows the value of the RSI.
PeriodStoch: The default value is 8. It shows the value of the Stochastics.
PeriodSK: The default value is 5. It tells the value of the Stochastics K line.
PeriodSD: The default value is 5. It tells the value of the Stochastics K line.
MAMode: The default value is 0. It tells the value of the MA.
FAQs About the MT4 DT Oscillator Indicator
What is the DT Oscillator Indicator?
The DT Oscillator is a technical analysis tool that merges RSI and Stochastic calculations to identify overbought and oversold conditions, helping traders anticipate reversals and trend shifts.
How does the DT Oscillator differ from RSI or Stochastics alone?
While RSI or Stochastics can each show momentum, the DT Oscillator blends both, resulting in smoother readings and fewer false signals.
Which timeframes work best for the DT Oscillator?
It can be used on any timeframe, but longer periods like H1, H4, or Daily are ideal for filtering out short-term market noise.
What are the key trading signals?
-
Buy near 20 when the line curves upward.
-
Sell near 80 when the line starts to turn down.
-
Use the 50 line as a trend filter.
-
Does the DT Oscillator repaint signals?
No. Once a value is plotted, it remains fixed, making it reliable for both live and back-tested trading.
Is the DT Oscillator available for MT5?
Yes, a compatible version is available for MetaTrader 5 as well.
Is it free to download?
Yes. The DT Oscillator Indicator is available as a free download for MT4 and MT5.