
Categories
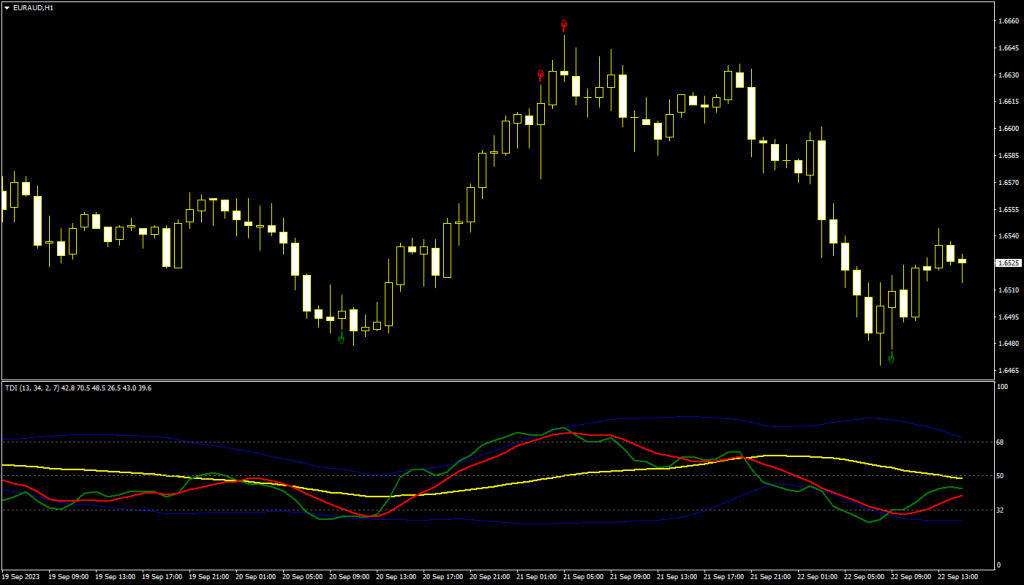
Traders Dynamic Index (TDI) MT4 Indicator
The Traders Dynamic Index (TDI) MT4 Indicator combines trend, momentum, and volatility to provide a complete view of market conditions. This guide explains how it works, strategies, and tips for trading effectively with TDI.
Download the Traders Dynamic IndexDownload Traders Dynamic Index (TDI) MT4 Indicator
The Traders Dynamic Index, often called TDI, is a versatile technical analysis indicator designed to give traders a complete view of the market. Developed by Dean Malone, it combines elements of trend analysis, momentum tracking, and volatility measurement into a single charting tool. Because it consolidates multiple insights in one place, many traders consider the TDI a go-to indicator for evaluating market direction and making trading decisions on MetaTrader 4.
Components of the TDI
The TDI is made up of three primary components, each offering unique information about market conditions.
Price Line (RSI)
The Price Line is based on the Relative Strength Index (RSI), which measures the speed and magnitude of price changes. It helps identify overbought and oversold zones, showing when a market may be due for a pullback or reversal.
Trade Signal Line (TSL)
The Trade Signal Line is a moving average of the Price Line. By smoothing out fluctuations, it reduces noise and makes it easier to spot the dominant trend. Crossovers between the Price Line and Trade Signal Line often provide buy or sell signals.
Market Base Line (MBL)
The Market Base Line is a longer-term moving average that reflects the broader market trend. When the Price Line is above the MBL, the overall direction is considered bullish. When it is below, the market is seen as bearish.
How to Interpret the Traders Dynamic Index
Overbought and Oversold Conditions
When the Price Line moves above the upper band of the TDI, it signals that the market may be overbought and could reverse downward. If it drops below the lower band, it suggests oversold conditions and a potential move upward.
Trend Confirmation
The TDI helps confirm whether a market is trending or ranging. If the Price Line remains above the MBL, it supports a bullish trend. If it stays below, it supports a bearish trend. This makes it easier for traders to stay aligned with the broader market direction.
Trading Strategies Using TDI
TDI Cross Strategy
-
A buy signal occurs when the Price Line crosses above the Trade Signal Line.
-
A sell signal occurs when the Price Line crosses below the Trade Signal Line.
This strategy is straightforward and works well in trending conditions but can give false signals during sideways markets.
TDI Divergence Strategy
Divergence occurs when the Price Line moves in the opposite direction of price action.
-
If the Price Line makes higher highs while price makes lower highs, it signals a bearish divergence and a possible reversal downward.
-
If the Price Line makes lower lows while price makes higher lows, it signals a bullish divergence and a possible reversal upward.
Divergence can be a powerful early warning of changing momentum.
Limitations and Risks of the TDI
The TDI, like any indicator, has limitations. It can produce false signals in range-bound or choppy markets. It also does not account for fundamental news or economic data that may drive price action. Relying on it alone may reduce trading accuracy.
To overcome these risks, traders often combine the TDI with:
-
Support and resistance levels
-
Moving averages or trendlines
-
Fundamental analysis
-
Proper risk management, including stop-losses and position sizing
Who Can Use the Traders Dynamic Index?
The TDI can be used by traders of all experience levels.
-
Beginners appreciate the visual clarity of the lines and bands.
-
Experienced traders use it for fine-tuning entries and exits, often combining it with other technical tools.
It is adaptable to any timeframe, from short-term scalping on 5-minute charts to long-term swing trading on daily or weekly charts.
Example Uses of TDI in Scanners and Strategies
Platforms like TrendSpider and MT4 custom tools allow the TDI to be used in scanning and backtesting. Traders can create scans for setups such as long entries based on TDI crossovers, or test strategies based on divergence patterns. These applications highlight the indicator’s flexibility and practical use in both manual and automated systems.
- InpPeriodRSI (default 13) — RSI calculation period.
- InpAppliedPriceRSI (default PRICE_CLOSE) — Applied price used for the RSI.
- InpPeriodVolBand (default 34) — Period for the volatility band drawn around the RSI.
- InpPeriodSmRSI (default 2) — Smoothing period for the fast (green) RSI price line.
- InpMethodSmRSI (default MODE_SMA) — Moving average method used to smooth the fast RSI line.
- InpPeriodSmSig (default 7) — Smoothing period for the slow (red) signal line.
- InpMethodSmSig (default MODE_SMA) — Moving average method used to smooth the signal line.
- InpOverbought (default 68) — Overbought reference level.
- InpOversold (default 32) — Oversold reference level.
- InpShowBase (default No) — Toggles the market base (50) line.
- InpShowVBL (default No) — Toggles display of the volatility band lines.
FAQs About the MT4 Traders Dynamic Index
What is the Traders Dynamic Index (TDI)?
The TDI is a custom MT4 indicator that combines RSI, moving averages, and volatility bands. It is used to identify trend direction, momentum, and overbought or oversold conditions in one view.
Who developed the TDI?
The Traders Dynamic Index was created by Dean Malone as part of his trading system.
What makes the TDI unique?
Unlike standalone RSI or moving averages, the TDI integrates multiple tools into one indicator. This provides traders with a more complete perspective without needing to add several indicators to the chart.
What are the main strategies for using TDI?
The two most common strategies are:
-
TDI Cross: Watching for crossovers between the Price Line and Trade Signal Line.
-
TDI Divergence: Identifying when momentum diverges from price action.
-
Can I use the TDI on any timeframe?
Yes. The TDI works on all timeframes in MT4. Shorter timeframes are used for scalping and day trading, while longer timeframes are used for swing and position trading.
Is the TDI free to download for MT4?
Yes, many versions of the TDI are available as free MT4 downloads. Some custom versions may include advanced alerts or dashboards for paid upgrades.
What are the risks of relying only on the TDI?
The TDI can produce false signals during sideways markets. It does not include fundamental analysis, so traders should always confirm signals with other tools and proper risk management.