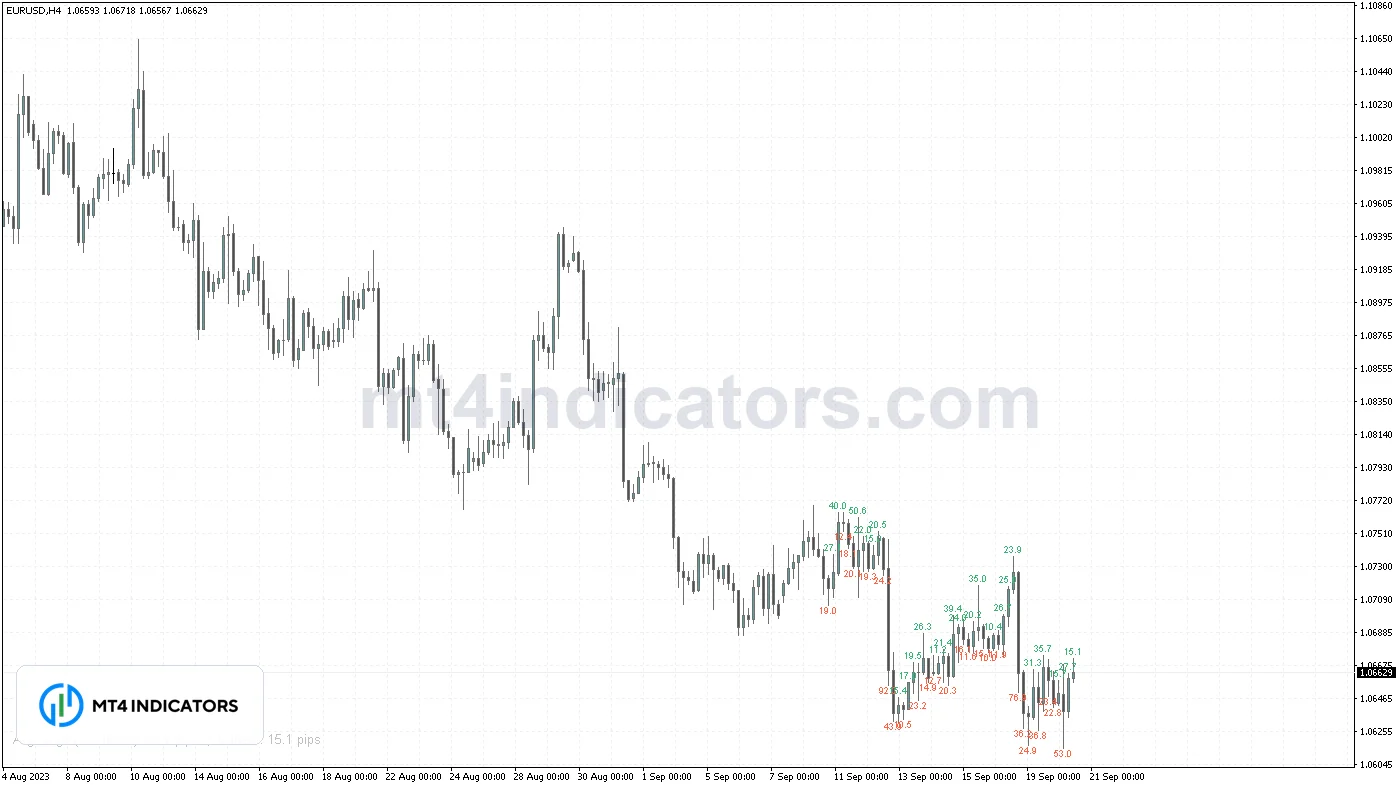
The Candle Pips indicator for MT4 writes the size of each candle, in pips, directly on the chart for the last 50 candles, and shows the average candle size of the last 20 closed candles in a corner. You can measure the full high-to-low range or only the body, and it handles 5-digit and 3-digit brokers correctly.
Instead of dragging the crosshair over every bar, you can see at a glance how far price is traveling and whether today’s candles are larger or smaller than usual. It is a free download that runs on any symbol and timeframe.
What Is the Candle Pips Indicator?
A candle size indicator measures how far price moved inside each bar. Traders use that number in many ways: to judge volatility, to size stops and targets, to filter breakout candles, and to spot when a market has gone quiet. The Candle Pips indicator does the measuring for you and prints the result in small colored text above or below each candle.
It also keeps a running average. If the last 20 closed M15 candles averaged 6.5 pips and the current candle is already 14 pips, you know immediately that something unusual is happening.
How the Indicator Is Calculated
Pip size
Most forex brokers quote majors with five decimals (1.08452) and yen pairs with three (157.214). On those quotes the last digit is a fractional pip, so one pip equals 10 points. On 4-digit and 2-digit quotes one pip equals one point. The code follows that rule: if the symbol has 3 or 5 digits, a pip is 10 times the point size, otherwise it is one point. On metals, indices and crypto, brokers use different pip conventions, so treat the number as “points divided by 10” on 3- and 5-digit symbols and “points” on others.
Candle size
- Range mode (default): (high minus low) divided by the pip size. This includes the wicks and is the true distance price traveled.
- Body mode: the absolute value of (close minus open) divided by the pip size. This ignores wicks and shows how much ground the candle actually gained or lost.
Average
The readout adds up the size of the last AveragePeriod closed candles (bar 1 back to bar 20 by default) using the same measure, divides by the count, and shows it next to the size of the live candle, for example “Avg range (20 closed): 8.4 pips | Current: 3.1 pips”. The live candle is not included in the average, so the average does not jump around while the candle forms.
Labels
Each label is a text object anchored to its candle. In the default auto mode, bullish candles (close at or above open) are labeled in green above the high and bearish candles in red below the low, so the numbers do not cover the bodies. When a new candle opens, the labels are redrawn so only the most recent BarsToLabel candles carry a number. On every tick in between, only the live candle’s label is updated, which keeps the indicator light.
Key Features
- Pip size of every recent candle printed on the chart, range or body.
- Correct pip conversion for 5-digit and 3-digit quotes.
- Average candle size over closed candles, plus the live candle’s size, in one readout.
- Bullish and bearish label colors and automatic above/below placement.
- Candle size also shown in the Data Window for every bar on the chart, not only the labeled ones.
- All objects use one prefix and are removed when you delete the indicator.
How to Trade With the Candle Pips Indicator
Setting stops and targets
The average range gives you a realistic yardstick. A 5-pip stop on a pair whose M15 candles average 12 pips is likely to be hit by normal noise. Many traders keep stops at a multiple of the average range, or at least beyond one full average candle from entry. Once you have a stop distance, the Position Size Calculator indicator or the online position size calculator turns it into a lot size.
Filtering breakout candles
A breakout candle that is two or three times the average size shows strong momentum. A breakout on a candle smaller than average is weaker. Combine the size check with volume from the Volume MA indicator for a fuller picture.
Scalping conditions
Scalpers need movement. If the average M1 or M5 range is barely larger than the spread, there is little room left for profit. Checking the readout against the spread shown by the Candle Timer indicator is a quick way to decide whether a session is worth trading.
Spotting compression
A run of candles well below the average often comes before a larger move. That is the same idea behind volatility squeeze tools, and the Inside Bar indicator marks one common compression pattern.
Checking older candles
Labels are limited to recent candles to keep the chart clean, but the size of every candle on the chart is stored in the indicator’s buffer. Open the Data Window (Ctrl+D) and hover over any older bar to read its range or body in pips. This is useful when you review how a pair behaved around past news releases or session opens.
Best Settings
- BarsToLabel 30 to 50 keeps the chart readable. Very high values create many text objects and clutter zoomed-out charts.
- DecimalPlaces 0 is cleaner on H4 and D1, where candles are tens or hundreds of pips.
- MEASURE_BODY suits traders who care about closes, for example when judging the strength of a breakout close.
- AveragePeriod 14 to 20 gives a stable baseline that still reacts to session changes.
Does It Repaint?
No. A closed candle’s high, low, open and close never change, so its label stays the same. Only the live candle’s label and the “Current” value update while that candle is forming, which is expected. The average is built from closed candles only. When a new candle opens, older labels beyond the BarsToLabel limit are removed, but no value is ever rewritten. See what repainting is for more.
How to Install
Copy “candle-pips-indicator-mt4.mq4” into File > Open Data Folder > MQL4 > Indicators, restart MT4 or refresh the Navigator, and drag it onto a chart. The full guide is how to install indicators in MT4.
Related Indicators
- Damiani Volatmeter indicator tells you whether volatility is high enough to trade.
- Pin Bar indicator marks long-wick rejection candles.
- Engulfing Pattern indicator finds candles that swallow the previous body.
- Spread Watch indicator tracks the cost side of small candles.
More tools like this are listed under informational indicators. Candle size describes past volatility and does not predict the next candle. Trading on margin carries a high level of risk, so test your rules on a demo account first.