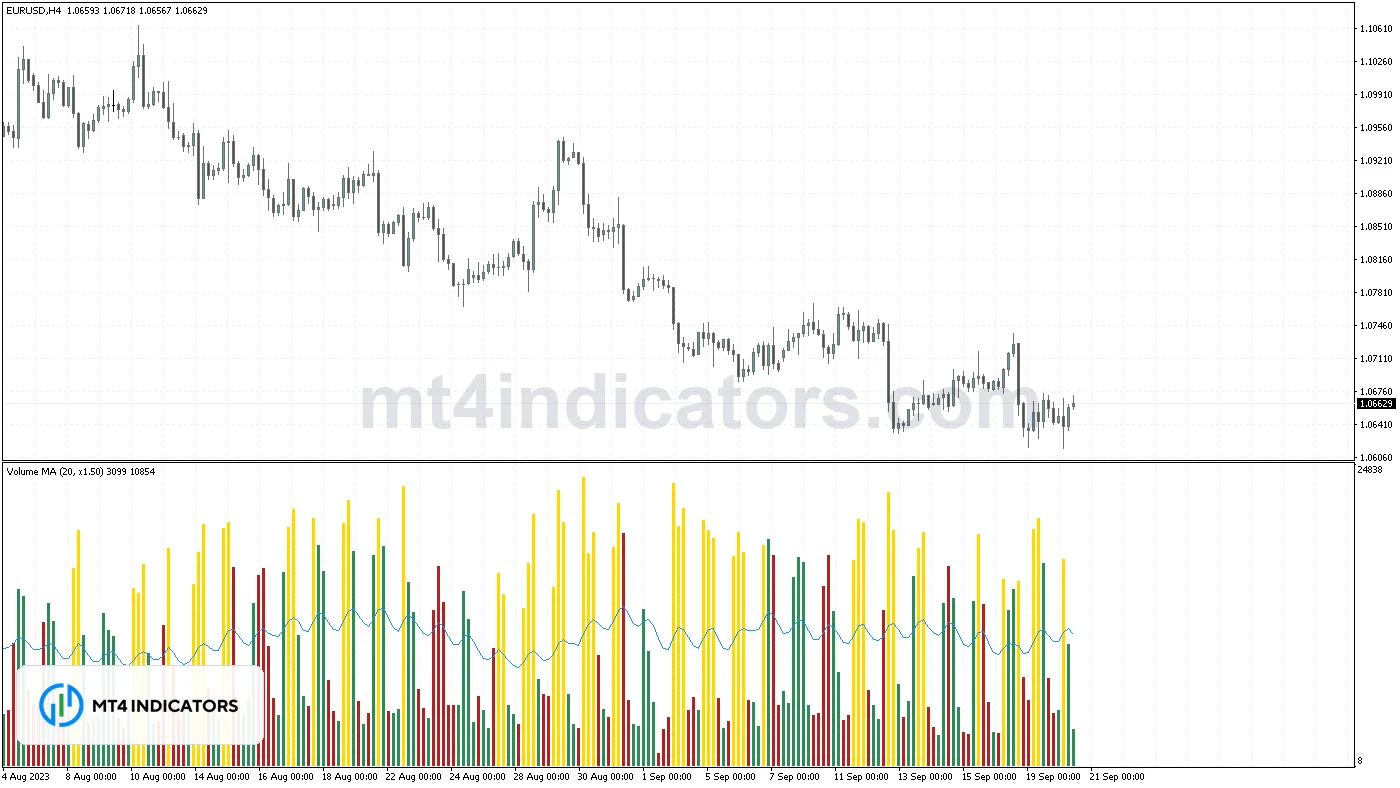
The Volume MA indicator for MT4 shows tick volume as a colored histogram in its own window, adds a moving average of that volume, and paints any bar in gold when its volume is more than 1.5 times the average. It gives you a quick way to see whether a breakout or a reversal candle came with real activity behind it.
MetaTrader 4 already has a Volumes indicator, but it has no average line and no way to flag unusual activity. This free tool adds both while keeping the classic up/down coloring.
What Is the Volume MA Indicator?
Volume measures participation. A price move on rising volume shows more activity behind it than the same move on thin volume. The problem is that raw volume bars are hard to judge on their own: is 1,800 a lot or a little? A moving average of volume answers that by giving you a baseline. Bars well above the line stand out, bars below it show a quiet market.
In spot forex there is no central exchange, so MT4 does not show traded contracts. It shows tick volume, the number of price changes your broker received during each bar. Tick volume is a measure of activity rather than size, and it differs a little from broker to broker, but it tends to rise and fall with real market activity. That is the data this indicator uses.
How the Indicator Is Calculated
For every bar the code reads the tick volume and does three things:
- Moving average. It calculates a moving average of tick volume over MaPeriod bars (20 by default) with the method you select. The simple average is the sum of the last 20 volumes divided by 20. Exponential and smoothed averages are seeded with a simple average and then updated bar by bar. The linear weighted average gives the newest bar the largest weight.
- Spike test. If the bar’s volume is greater than the moving average multiplied by SpikeMultiplier (1.5 by default), the whole bar is drawn in SpikeColor.
- Up or down color. Bars that are not spikes are colored by ColorMode. In the default candle mode, a bar is “up” when the candle closed at or above its open and “down” when it closed below. In previous-volume mode, a bar is “up” when its volume is equal to or higher than the bar before it.
The moving average line is drawn over the histogram so you can see at a glance where each bar sits against the baseline.
How it differs from the built-in Volumes indicator
The standard MT4 Volumes indicator colors each bar green or red by comparing its volume with the previous bar. That is the same idea as this tool’s COLOR_BY_PREV_VOLUME mode. The Volume MA indicator adds the candle-direction mode, the moving average baseline, the spike color and the alerts, so you can judge each bar against recent activity instead of only against the bar before it.
Key Features
- Up, down and spike colors in one histogram.
- Volume moving average with four methods: SMA, EMA, SMMA and LWMA.
- Adjustable spike threshold, from subtle (1.2x) to strict (2x or more).
- Two coloring modes: by candle direction or by change in volume.
- Optional alert and mobile push when a closed bar qualifies as a spike.
- Each value (up, down, spike and the average) shows in the Data Window.
How to Trade With the Volume MA Indicator
Volume is a confirmation tool. It works best alongside price levels, not as a buy or sell signal by itself.
Confirming breakouts
- Mark a range, a session high or low, or a support and resistance level.
- When price closes through the level, check the volume window. A gold spike bar on the breakout candle shows strong participation and is the kind of breakout many traders prefer to follow.
- A breakout on volume below the average line deserves more caution, because it has less activity behind it.
- Place the stop back inside the range, beyond the opposite side of the breakout candle or the level that broke.
Session opens are where tick volume usually expands. The Trading Sessions indicator and the market sessions tool help you line those times up with the volume bars.
Spotting climax and exhaustion
After a long run in one direction, an unusually large spike with a long wick can mark a climax where late traders pile in and early traders take profit. If the next bars fail to make progress on falling volume, a pause or reversal becomes more likely. Combine this with candlestick patterns such as the Pin Bar indicator rather than trading the spike alone.
Reading quiet markets
Long stretches of bars under the average line mean low activity. Ranges tend to form there, and breakout trades taken during very quiet hours often lack follow-through.
Best Settings
- MaPeriod 20, SMA, multiplier 1.5: the default, good for M5 to H1 day trading.
- Multiplier 2.0: only the clearest spikes are highlighted. Use it on M1 and M5 where volume is noisy.
- MaMethod MODE_EMA: the baseline reacts faster when activity shifts between sessions.
- ColorMode COLOR_BY_PREV_VOLUME: useful if you want to see whether activity is building or fading, independent of candle color.
Tick volume has a daily rhythm, so a 20-bar average on M15 mostly reflects the current session. On H4 and D1 a period of 20 covers several days and gives a steadier baseline.
Does It Repaint?
No. Once a bar closes, its volume, color, spike status and average value are fixed. On the live bar, tick volume keeps growing until the bar closes, so that bar can change height, switch from up to down color (in candle mode) or turn gold partway through. That is how every volume indicator behaves, because the volume is still being counted. The optional alert only looks at the bar that has just closed, so it will not alert on a spike that later fails to hold. More on this in what repainting is.
How to Install
Place “volume-ma-indicator-mt4.mq4” in File > Open Data Folder > MQL4 > Indicators, restart MT4 or refresh the Navigator, and drag the indicator onto your chart. It opens in a separate window under price. See how to install indicators in MT4 for a full guide.
Related Indicators
- Chaikin Money Flow (CMF) indicator combines volume with where price closes in its range.
- Market Facilitation Index indicator compares range to volume.
- Bollinger Squeeze Advanced indicator finds low-volatility periods before breakouts.
- Candle Pips indicator shows how far each candle traveled.
Browse more volume trading tools. Volume confirms what price is doing but does not predict it, and tick volume varies between brokers. Trading on margin carries a high level of risk, so practice on a demo account first.