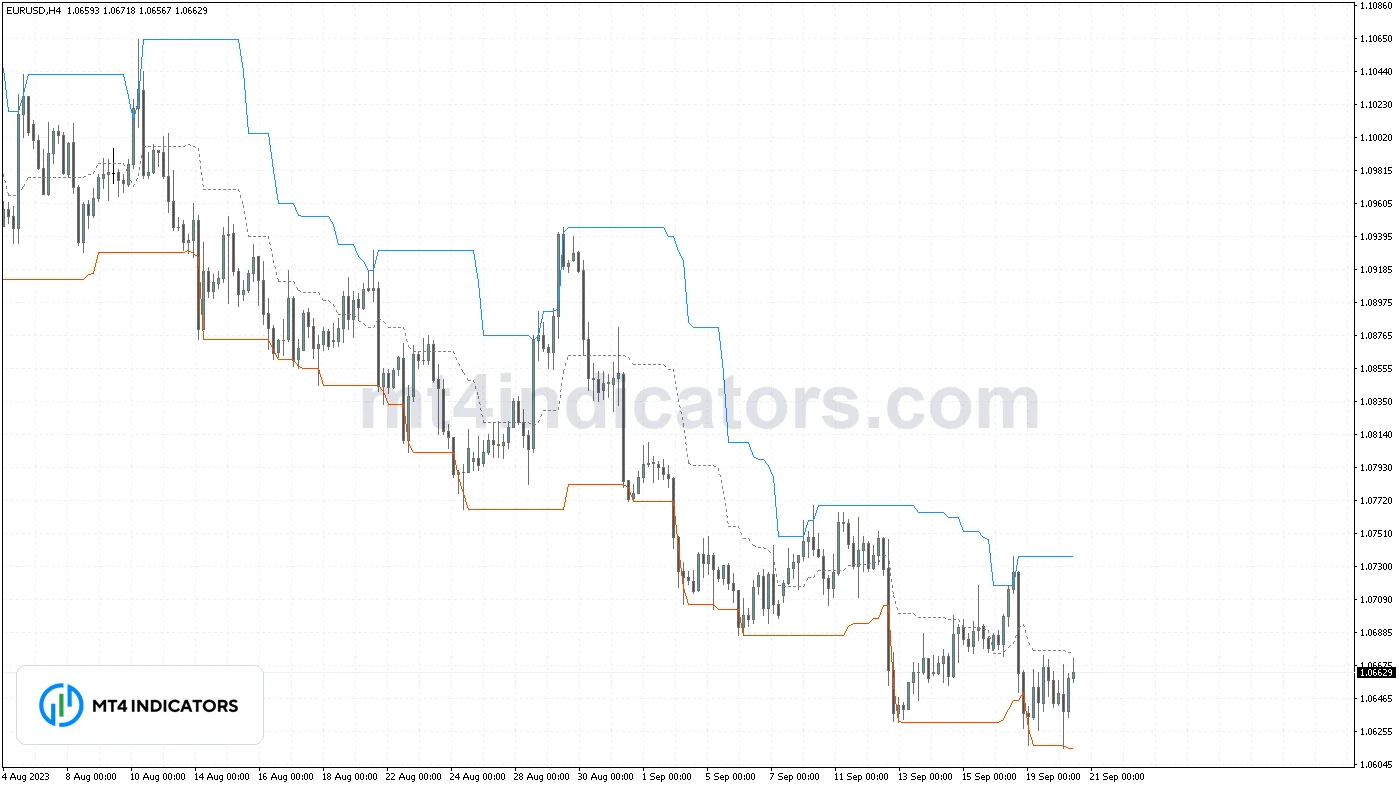
The Donchian Channel indicator for MT4 draws the highest high and lowest low of the last N bars as an upper and lower band, with an optional midline between them. It shows the recent trading range at a glance and can alert you when a closed candle breaks out of that range, which makes it a classic breakout and trend-following tool.
Donchian channels were made famous by trend-following breakout systems that bought new N-bar highs and sold new N-bar lows. This free MetaTrader 4 version keeps the calculation plain and adds closed-bar breakout alerts, so you do not have to watch the chart all day.
What Is the Donchian Channel Indicator?
A Donchian channel is a price envelope built only from highs and lows. The upper band is the highest high over a lookback period, the lower band is the lowest low over the same period, and the middle line is the average of the two. There is no smoothing and no volatility formula, so the bands move in steps: the upper band only rises when price makes a new high and only falls when an old high drops out of the window.
That makes the channel easy to read. When price pushes against the upper band, it is making new highs for the period. When the channel is flat and narrow, the market is consolidating.
How it is calculated
- Upper band = highest high of the last ChannelPeriod bars.
- Lower band = lowest low of the same bars.
- Midline = (upper + lower) / 2, shown when ShowMiddle is true.
With ExcludeCurrentBar set to true (the default), the bands on each bar are calculated from the N bars before it. That means a candle can close above the upper band, which is exactly what a breakout looks like. With it set to false, the current bar is included in its own window, so price touches the band but can never close outside it.
The breakout alert always uses the same rule, whichever setting you choose: when a new bar opens, the indicator checks whether the candle that just closed finished above the highest high, or below the lowest low, of the ChannelPeriod bars before it.
Key Features
- Upper, lower and middle bands with independent colors.
- Option to exclude the current bar so breakouts are visible on the chart.
- Pop-up and push alerts on closed-candle breakouts only, once per bar.
- Bands are indicator buffers, so you can read exact values in the Data Window or call them from an Expert Advisor with iCustom.
- Lightweight calculation that only updates the newest bar on each tick.
How to Trade With the Donchian Channel Indicator
Breakout entries
- Wait for a candle to close above the upper band (with ExcludeCurrentBar true) for a long trade, or below the lower band for a short trade. The alert fires on exactly this event.
- Check the bigger picture. Breakouts in the direction of the higher-timeframe trend tend to be cleaner than breakouts against it.
- Enter on the next bar’s open, or wait for a pullback toward the broken band.
- Place the initial stop at the midline or at the opposite band for a wider, trend-following stop.
Trailing exits
Many trend followers use a shorter Donchian channel as a trailing stop. For example, enter on a 20-bar breakout and exit a long position when price closes below the 10-bar lower band. You can load the indicator twice with different periods to see both.
Filtering false breakouts
Breakout systems take many small losses in sideways markets. A trend-strength filter helps: the Advanced ADX indicator or the Choppiness Index can tell you whether the market is trending or ranging before you act on a breakout. A narrowing channel that coincides with a Bollinger squeeze often comes before a larger move.
Using the midline and channel width
The midline is a simple trend reference. In a healthy uptrend, pullbacks often hold above it; a close back below the midline after a long run is an early sign the move is losing strength. Some traders only take long breakouts while price has stayed above the midline for the last several bars, and only short breakouts while it has stayed below.
The distance between the bands is also worth watching. A wide channel means price has covered a lot of ground recently, so a stop at the opposite band will be large and position size has to shrink to match. A narrow, flat channel means a quiet market. Work out the lot size from the actual stop distance rather than a fixed lot, for example with the position size calculator.
Best Settings
- Swing trading (H4 to D1): ChannelPeriod 20 for entries; add a second copy with 10 for trailing exits.
- Longer-term trend following (D1): ChannelPeriod 55 gives fewer, longer-lasting signals.
- Day trading (M15 to H1): ChannelPeriod 20 to 24, combined with session times so you are not trading breakouts in the quiet Asian hours.
- ExcludeCurrentBar: leave it true for breakout trading. Set it false if you only want to see the range including the current bar.
Does It Repaint?
No. The Donchian Channel is non-repainting. Each bar’s bands are calculated from a fixed window of bars and never change once the bar has closed. With ExcludeCurrentBar true, even the current bar’s bands are fixed, because they only use closed candles. With it false, the current bar’s bands can move while that bar is still forming, which is normal current-bar behavior. Alerts only fire after a candle closes. Our article on what repainting is explains the difference.
How to Install
Download the free file, then in MetaTrader 4 open File > Open Data Folder > MQL4 > Indicators and copy donchian-channel-indicator-mt4.mq4 into that folder. Restart the terminal or right-click Indicators in the Navigator and choose Refresh, and the indicator compiles and appears under Indicators > Custom. Drag it onto a chart and adjust the inputs in the window that opens. The full walkthrough, with fixes for common problems, is in our guide on how to install indicators in MT4. This is an MT4 file, so it will not load in MetaTrader 5 (the two platforms use different file formats), and the MT4 mobile apps cannot run custom indicators at all, as explained in our MT4 mobile indicators guide.
Related Indicators
- Donchian Channels System Indicator MT5 for MetaTrader 5.
- Steinitz Fractal Breakout Indicator MT4 for fractal-based breakout levels.
- Bollinger Squeeze Advanced Indicator MT4 to spot volatility compression before breakouts.
- SuperTrend Indicator MT4 for an ATR-based trailing stop line.
Explore more breakout trading indicators in the library.
Trading on margin carries a high level of risk, so test any new tool on a demo account before you use it with real money.