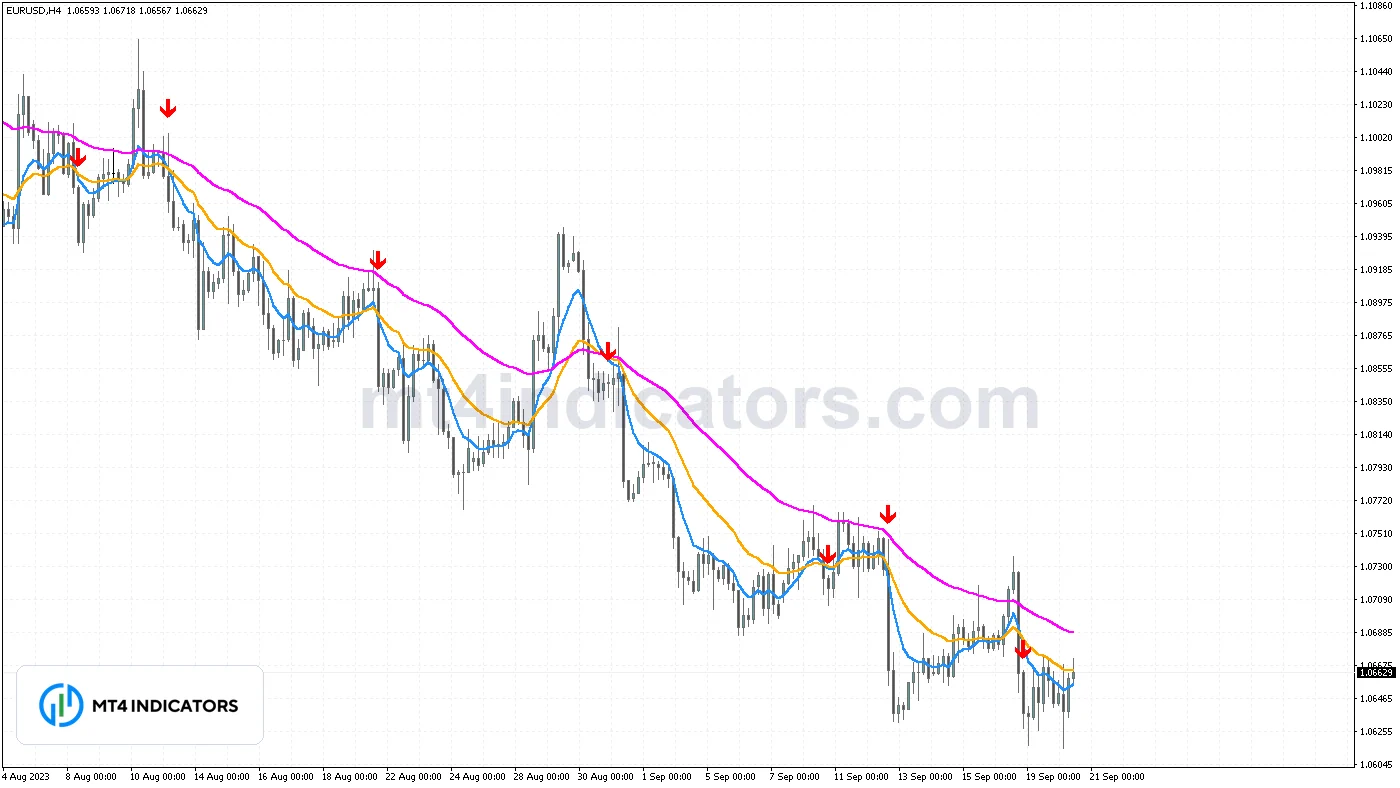
The 3 EMA Crossover indicator for MT4 plots three exponential moving averages, 8, 21 and 55 by default, and prints a buy or sell arrow when the fast EMA crosses the middle EMA while both are on the same side of the slow EMA. Arrows are checked on closed candles only, so they do not repaint.
It is a free download that turns a popular manual setup, the “3 EMA” trend method, into something you can see at a glance and get alerts for. You keep full control of the periods, price source and colors, and nothing on the chart is hidden or recalculated after the fact.
What Is the 3 EMA Crossover Indicator?
A 3 EMA indicator for MT4 stacks a short, a medium and a long exponential moving average on the price chart. The long EMA tells you which side of the market you should favor. The two shorter EMAs tell you when momentum is turning in that direction. Traders have used versions of this idea for years, with pairs such as 5/13/50, 8/21/55 or 9/21/50. This version uses 8, 21 and 55 by default, three numbers from the Fibonacci sequence that many chartists like because they spread nicely across short, medium and longer horizons.
The difference between this tool and simply adding three Moving Average indicators to a chart is the signal logic. Instead of you scanning for crossovers by eye, the indicator marks the exact candle where the fast and middle EMAs crossed while the slow EMA confirmed the trend, and it can alert you when that happens.
How the Indicator Is Calculated
Each line is a standard exponential moving average, calculated with MetaTrader’s built-in EMA on the applied price you choose (close by default). An EMA weights recent prices more heavily than older ones, so it reacts faster than a simple moving average of the same length.
On every closed candle the code checks two conditions:
- Buy arrow: on that candle the fast EMA is above the middle EMA, on the previous candle it was at or below it, and on that same candle both the fast and the middle EMA are above the slow EMA.
- Sell arrow: the fast EMA is below the middle EMA after being at or above it on the previous candle, and both the fast and the middle EMA are below the slow EMA.
A crossover that happens on the “wrong” side of the slow EMA, for example the fast EMA crossing up through the middle EMA while both are still below the 55, is ignored. That filter is what separates this from a plain two-line crossover, which fires in both directions all through a range.
The arrow is drawn below the low (buy) or above the high (sell) of the signal candle, offset by half of the 14-period Average True Range by default, so it stays readable on any pair and timeframe.
Key Features
- Three EMAs with editable periods, applied price, colors and line width.
- Buy and sell arrows only when the fast/middle crossover agrees with the slow EMA trend filter.
- Signals evaluated on closed candles only, so arrows do not appear and disappear during a candle.
- Optional pop-up alert, sound and push notification to the MT4 mobile app, sent once per candle.
- Arrow distance scales with ATR, so it works the same on EUR/USD M5 and gold H4.
- Values for all three EMAs and both signals appear in the Data Window for exact readings.
How to Trade With the 3 EMA Crossover Indicator
Treat the arrows as a trend-continuation trigger, not as a stand-alone system. A practical way to use them:
Buy setup
- Price is trading above the slow (55) EMA and the slow EMA is rising or at least flat.
- A pullback pushes the fast EMA below the middle EMA, then a blue-over-orange cross prints a buy arrow when the candle closes.
- Enter on the open of the next candle, or on a break of the arrow candle’s high if you want extra confirmation.
- Place the stop below the most recent swing low or below the slow EMA, whichever gives the trade more room. The free position size calculator turns that stop distance into a lot size.
Sell setup
- Price is below a falling slow EMA.
- After a bounce, the fast EMA crosses back below the middle EMA and a sell arrow prints on the closed candle.
- Stop above the latest swing high or the slow EMA.
Managing the trade
Common exits include a fixed reward-to-risk target, trailing the stop behind the middle EMA, or closing when the fast EMA crosses back over the middle EMA. When the three EMAs flatten and twist around each other, the market is ranging and crossover signals lose their edge. A filter such as the Choppiness Index indicator or the higher-timeframe trend can help you skip those periods.
Best Settings
The 8/21/55 defaults suit intraday charts from M15 to H1 and swing charts on H4 and D1. A few practical variations:
| Use | Fast / Middle / Slow | Notes |
|---|---|---|
| Default, all-round | 8 / 21 / 55 | Balanced between speed and noise. |
| Faster intraday | 5 / 13 / 50 | More signals on M5 and M15, more false crosses. |
| Slower swing | 10 / 30 / 100 | Fewer, later signals on H4 and D1. |
Keep the fast period well below the middle period and the middle well below the slow one. If the three values are too close together, the trend filter stops meaning much. Test any change on a demo account before using it live.
Does It Repaint?
No. The arrow logic runs only on candles that have already closed, starting from bar 1. The live candle (bar 0) never receives an arrow, so you will not see a signal appear mid-candle and then vanish. Once an arrow prints it stays in place. The EMA lines themselves update on the live candle as price moves, which is normal for any moving average, and they stop changing when the candle closes. Alerts fire once, right after the signal candle closes. Read more about why this matters in our guide to what repainting means, or browse other non-repainting indicators.
How to Install
Download the file, open MetaTrader 4, go to File > Open Data Folder > MQL4 > Indicators and copy the .mq4 file there. Restart MT4 or right-click Indicators in the Navigator and choose Refresh, then drag “3-ema-crossover-indicator-mt4” onto a chart. The full walkthrough is in how to install indicators in MT4. Custom indicators run on the desktop terminal only, not in the MT4 mobile apps, although push alerts can be sent to your phone.
Related Indicators
- Rainbow EMA indicator shows a whole ribbon of EMAs instead of three.
- Parabolic SAR Signals indicator offers trailing-stop style trend signals.
- SuperTrend Bar MTF indicator checks trend direction across several timeframes.
- Schaff Trend Cycle indicator adds a faster momentum read.
- RSI Divergence indicator warns when a trend is losing momentum.
You can find more tools for this approach on the trend trading page. Moving average signals lag price by design, and no crossover rule works in every market. Trading on margin carries a high level of risk, so size positions carefully and practice on a demo account first.