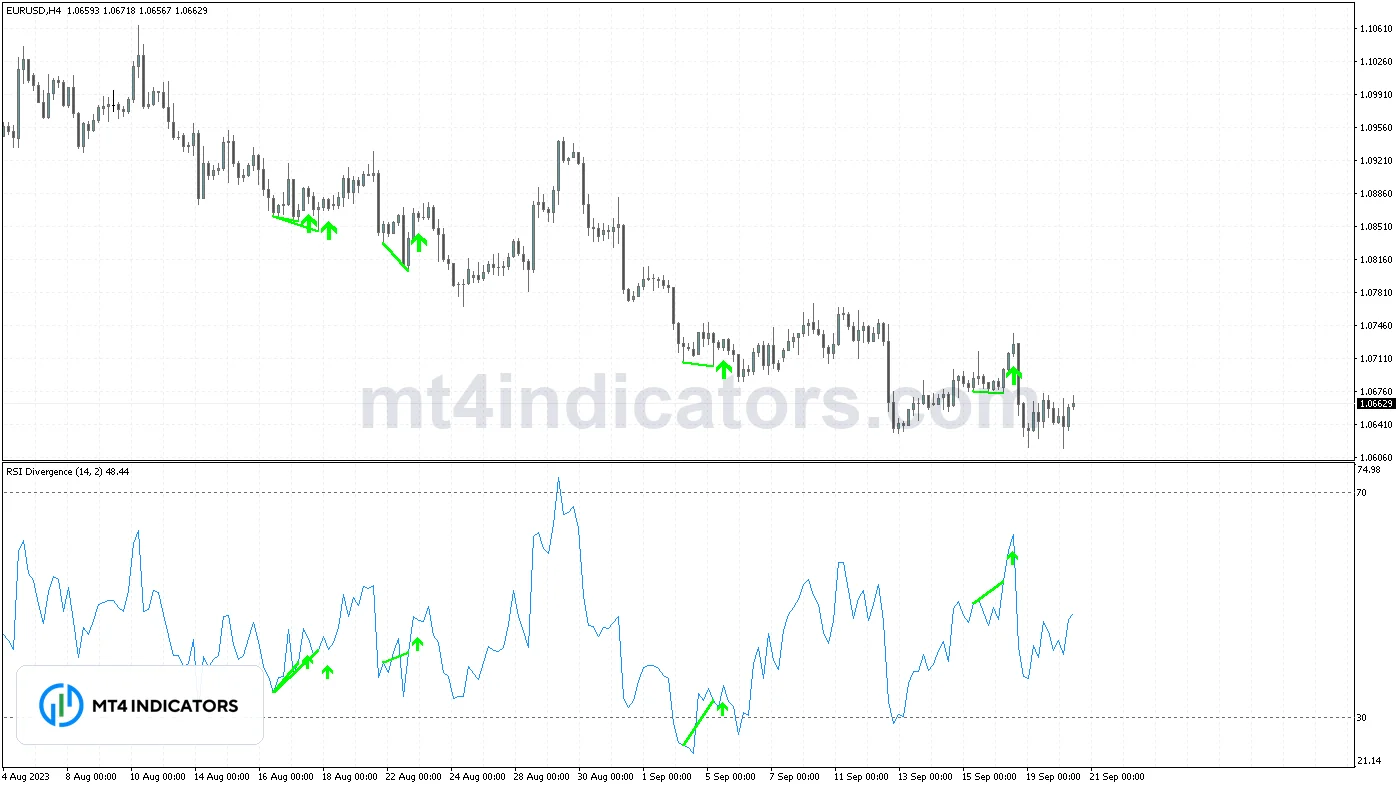
The RSI Divergence indicator for MT4 plots the Relative Strength Index in its own window and automatically finds divergence between confirmed price swings and RSI. It draws matching lines on the price chart and the RSI window, adds arrows, and can send alerts. Swings are confirmed 2 candles late by default, but once a divergence is drawn it does not move or disappear.
Spotting divergence by eye is slow and subjective. This free tool applies the same clear rules to every swing, so you can review past signals honestly and get notified of new ones.
What Is the RSI Divergence Indicator?
Divergence happens when price and momentum disagree. If price makes a lower low but RSI makes a higher low, selling momentum is weakening even though price is still falling. That is regular bullish divergence, a common early warning of a possible bounce or reversal. The mirror image, a higher high in price with a lower high in RSI, is regular bearish divergence.
Hidden divergence points the other way. In an uptrend, price makes a higher low while RSI makes a lower low, which suggests the pullback was deep in momentum terms but the trend structure held. Many traders read hidden divergence as a possible continuation signal. This indicator can show both types.
How the Indicator Is Calculated
RSI
The RSI line is MetaTrader’s standard RSI with your chosen period (14) and applied price (close), plotted from 0 to 100 with level lines at 70 and 30.
Swing highs and lows
Swings are found on price, not on RSI. A candle is a swing low when its low is lower than the lows of the PivotStrength candles after it and no higher than the lows of the PivotStrength candles before it. With the default of 2, that means a five-candle pattern with the lowest low in the middle. Swing highs use the same rule with highs. If two neighboring candles share the same extreme, only the newer one counts, so a flat double bottom is marked once.
A swing can only be confirmed once the candles after it have closed. With PivotStrength 2, a swing low is confirmed when the second candle after it closes. The live candle is never used.
Comparing swings
Each time a swing low is confirmed, the code looks back for the nearest earlier swing low that is at least MinSwingDistance (5) and at most MaxSwingDistance (60) bars older. It then compares the lows of the two candles and the RSI values on those same two candles:
| Type | Price | RSI |
|---|---|---|
| Regular bullish | Lower low | Higher value |
| Hidden bullish | Higher low | Lower value |
| Regular bearish | Higher high | Lower value |
| Hidden bearish | Lower high | Higher value |
Swing highs are handled the same way for the bearish types.
What gets drawn
- A line on the price chart from the older swing to the newer swing, and a matching line in the RSI window between the RSI values on those candles. Regular divergence uses solid lines, hidden divergence uses dotted lines.
- An arrow on the confirmation candle, the candle that closed and confirmed the newer swing, both on the price chart and in the RSI window. Up arrows are bullish, down arrows are bearish.
Placing the arrow on the confirmation candle rather than on the swing itself shows where the signal actually became available. That keeps historical charts honest when you scroll back.
Key Features
- Regular and optional hidden divergence, each with its own color.
- Lines on both the price chart and the RSI window, plus arrows in both.
- Adjustable swing strength and minimum and maximum distance between swings.
- Only closed candles are used, so signals never appear and then vanish.
- Alerts, sound and mobile push once per candle when a new divergence is confirmed.
- History scan limited by MaxBarsBack to keep the terminal responsive.
How to Trade With the RSI Divergence Indicator
Divergence shows weakening momentum. It is not a timing signal by itself, and strong trends can show several divergences in a row before turning. Use it with structure and confirmation.
Regular bullish divergence
- Best near support, at the lower edge of a range, or after an extended decline.
- Wait for confirmation, such as a bullish engulfing candle or a break of the most recent minor high.
- Place the stop below the newer swing low.
Regular bearish divergence
- Best near resistance or after an extended rally, ideally with RSI coming down from above 70.
- Confirm with a bearish candle pattern or a break of the latest minor low, and stop above the newer swing high.
Hidden divergence
Turn on ShowHidden and use it only in the direction of the larger trend: hidden bullish in uptrends, hidden bearish in downtrends. A trend filter such as the Rainbow EMA indicator or the slow line of the 3 EMA Crossover indicator helps you stay on the right side.
Candle patterns such as those found by the Engulfing Pattern indicator are a common way to confirm. Size each trade from the stop distance with the position size calculator.
Best Settings
- PivotStrength 2: the default, quick confirmation with more swings detected.
- PivotStrength 3 to 5: fewer, more significant swings, but each signal arrives later.
- MinSwingDistance 5, MaxSwingDistance 60: suits H1 to D1. On M5 and M15, a smaller maximum such as 30 to 40 keeps comparisons within the same market phase.
- RsiPeriod 14: the standard. Shorter periods produce more divergences, many of them minor.
Does It Repaint?
No, but it is delayed, and it is worth being exact about how. A swing cannot be known until the candles after it have closed, so with PivotStrength 2 every divergence appears two candles after the swing it is based on. At that moment the lines are drawn back to the two swing candles and the arrow is placed on the confirmation candle. From then on nothing changes: all the highs, lows and RSI values involved come from closed candles, so the drawing never moves, recolors or disappears. Reloading the chart rebuilds the same signals. Indicators that mark swings on the live candle often look better on history but redraw in real time. See what repainting is for the difference.
How to Install
Copy “rsi-divergence-indicator-mt4.mq4” to File > Open Data Folder > MQL4 > Indicators, restart MT4 or refresh the Navigator, and drag it onto a chart. It opens in a separate window under price. See how to install indicators in MT4 for details.
Related Indicators
- FX5 MACD Divergence indicator applies the same idea to MACD.
- All In One Divergence indicator checks several oscillators at once.
- Traders Dynamic Index (TDI) indicator builds a full system around RSI.
Divergence can persist for a long time in strong trends, and no oscillator signal is reliable on its own. Trading on margin carries a high level of risk, so test any divergence approach on a demo account first.