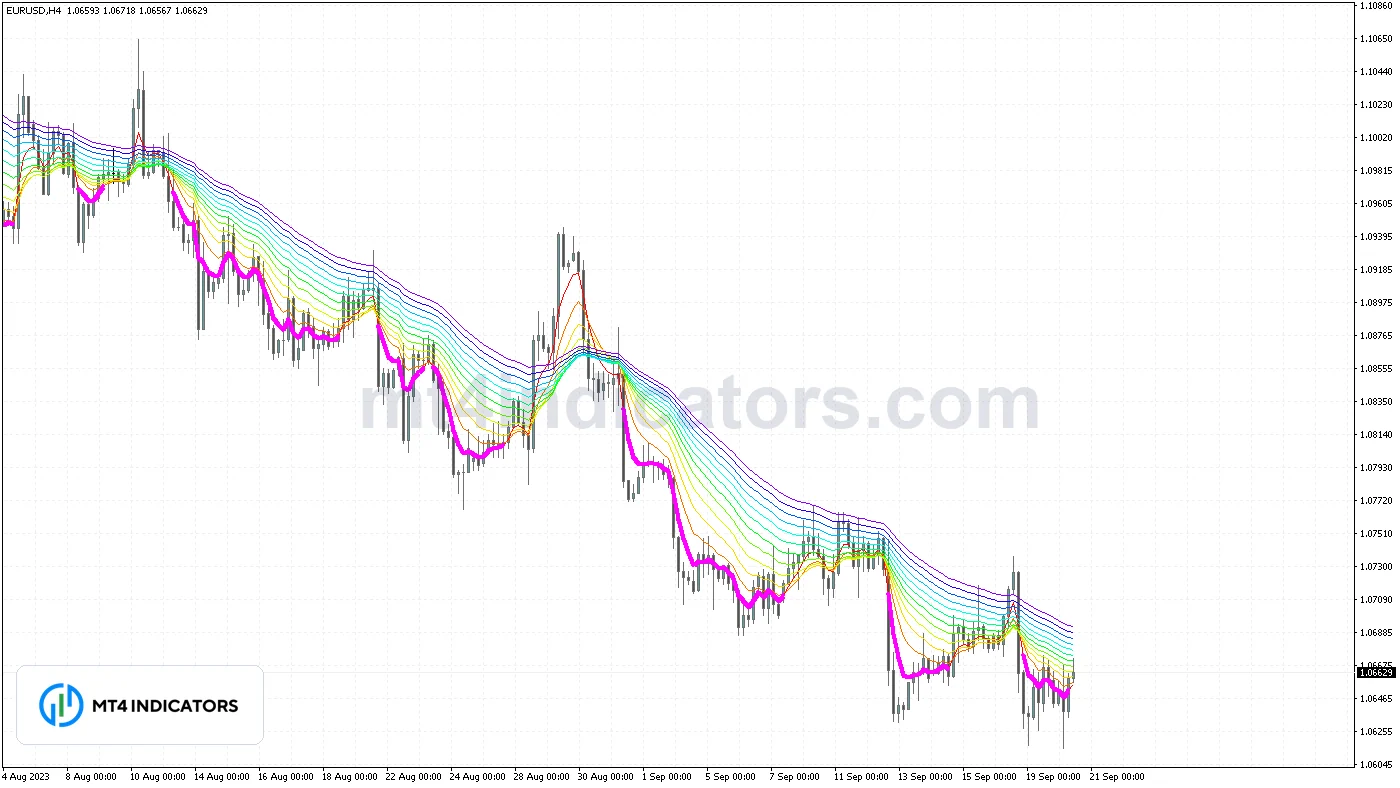
The Rainbow EMA indicator for MT4 draws a ribbon of up to 12 exponential moving averages, 5 through 60 by default, colored in a gradient from the fastest line to the slowest. When the ribbon fans out in perfect order the trend is strong, and an optional highlight marks every closed candle where all the EMAs are stacked bullish or bearish.
It is a free, lightweight version of the classic “rainbow” chart that many forex traders use to read trend strength and pullbacks at a glance, with clear inputs and no hidden logic.
What Is the Rainbow EMA Indicator?
A rainbow EMA, also called an EMA ribbon or moving average ribbon, plots many moving averages of increasing length on the same chart. One average can tell you direction. A dozen of them tell you how orderly that direction is. In a healthy uptrend the short EMAs sit above the longer ones and the ribbon widens. In a pullback the fast lines dip into the ribbon. In a range the colors tangle together and flatten.
The name comes from the color scheme: in the default mode the fastest line is red and each slower line shifts through orange, yellow, green and blue to violet, so you can tell which EMA is which without hovering over it. Traders searching for a “rainbow forex” indicator are usually looking for exactly this kind of ribbon.
How the Indicator Is Calculated
Every line is a standard exponential moving average calculated with MetaTrader’s built-in EMA on the price you choose (close by default). The periods are evenly spaced:
- EMA 1 uses StartPeriod.
- Each next EMA adds PeriodStep, so with StartPeriod 5, PeriodStep 5 and EmaCount 12 the ribbon is 5, 10, 15, 20, 25, 30, 35, 40, 45, 50, 55 and 60.
- EmaCount can be anything from 2 to 12. Unused lines are hidden.
Colors are assigned by position in the ribbon. In rainbow mode the hue moves from 0 degrees (red) on the fastest EMA to 270 degrees (violet) on the slowest, evenly spaced. In two-color mode each line is a straight blend between StartColor and EndColor.
The stack check is simple and strict. On each closed candle the code compares every EMA with the next slower one. If every faster EMA is above its slower neighbor, the ribbon is fully stacked bullish and the fastest EMA is overdrawn with a thick line in BullStackColor. If every faster EMA is below its slower neighbor, it is a bearish stack and the highlight uses BearStackColor. If even one pair is out of order, there is no highlight.
Key Features
- Ribbon of 2 to 12 EMAs with adjustable start period, step and applied price.
- Automatic rainbow gradient, or a custom two-color blend that matches your chart theme.
- Optional full-stack highlight that shows where the trend is perfectly aligned.
- Highlight evaluated on closed candles only, so it does not flicker on the live candle.
- Every EMA value is shown in the Data Window with its period as the label.
- No chart objects, no alerts to configure, very light on the terminal.
How to Trade With the Rainbow EMA Indicator
The ribbon works best as a trend map on H1, H4 and daily charts, which is why it suits swing trading. Some ways traders use it:
Trend direction and strength
Only look for longs when the ribbon is stacked bullish or mostly bullish, and only look for shorts when it is stacked bearish. A wide, evenly spaced ribbon shows a steady trend. A ribbon that is narrowing after a long run often comes before a pause or a reversal.
Pullback entries
- In a bullish stack, wait for price to pull back into the ribbon, ideally into the middle lines (for example the 20 to 35 EMAs).
- Enter when a candle closes back above the faster lines, or when the full-stack highlight returns after a short break.
- Place the stop below the pullback low or below the slowest EMA.
- Reverse the rules for shorts in a bearish stack.
Using two timeframes
A common routine is to load the ribbon on a higher timeframe, such as H4 or D1, and only trade in the direction of that stack. Then drop to H1 and use the same ribbon to time pullback entries. When both timeframes show a full stack in the same direction, the trend is aligned. When they disagree, it is usually better to wait for the lower timeframe to rejoin the higher one.
When to stand aside
When the colors cross over each other and the ribbon goes flat, there is no trend to follow. Pullback entries in that state tend to fail. Range tools, or a volatility filter like the Choppiness Index indicator, are better choices there.
Use the position size calculator to keep risk per trade consistent when stops are placed at the ribbon edge, since that distance changes from trade to trade.
Best Settings
| Goal | StartPeriod / PeriodStep / EmaCount | Ribbon |
|---|---|---|
| Default | 5 / 5 / 12 | 5 to 60 |
| Faster, intraday | 3 / 3 / 10 | 3 to 30 |
| Slower, swing | 10 / 10 / 10 | 10 to 100 |
A ribbon with fewer lines is easier to read on small screens, while 12 lines give a smoother picture of trend strength. The full-stack highlight is stricter with more lines, because more pairs have to be in order. If you rarely see it on your timeframe, lower EmaCount or the step.
Does It Repaint?
No. Every EMA on the live candle moves with price, which is normal for moving averages, and it is fixed once the candle closes. The full-stack highlight is only calculated from bar 1 backward, so the live candle never gets a highlight that could vanish before it closes. Because a line segment needs two points, a highlighted candle is drawn as a short segment that starts at the previous candle. That is a drawing detail, not a change in the signal. See what repainting is for why closed-candle logic matters when you review old charts.
How to Install
Copy “rainbow-ema-indicator-mt4.mq4” to File > Open Data Folder > MQL4 > Indicators, restart MT4 or refresh the Navigator, then drag it onto a chart. Step-by-step help, including what to do if it does not appear, is in how to install indicators in MT4.
Related Indicators
- 3 EMA Crossover indicator uses three EMAs with closed-candle buy and sell arrows.
- FRAMA indicator is a moving average that adapts to market noise.
- SuperTrend Bar MTF indicator shows trend direction across timeframes.
- Parabolic SAR Signals indicator gives trailing stop levels for trend trades.
More options are listed under trend indicators. A ribbon describes the trend that already happened and does not predict the next move. Trading on margin carries a high level of risk, so test any approach on a demo account first.